
Sector momentum asks whether leadership persists long enough to justify moving capital between industries. The first design choice is what leadership means. A sector can beat the market while losing money, and a rising sector can still lag the market. Ranking and trend are separate pieces of information.
The renewed chapter makes both decisions explicit. In a constructed twelve-month example, Technology, Industrials and Financials qualify with returns of 24%, 18% and 12%, compared with a market return of 10%. They share the portfolio equally. In a declining-market variant, relative winners remain, but every sector fails the positive-trend test and the portfolio holds cash. These are controlled examples of the rule, not historical performance results.
Specify selection before testing performance
At information month $t$, define trailing twelve-month momentum from a price series:
\[m_{i,t}=\frac{P_{i,t}}{P_{i,t-12}}-1.\]A sector is eligible when its score exceeds both zero and the broad-market score:
\[m_{i,t}>\max(0,m_{\mathrm{market},t}).\]Rank eligible sectors, select at most five, and divide capital equally among the selected holdings. If none qualifies, hold cash. The market series is a benchmark and cannot enter the selected sector list. A stable name order resolves ties.
This specification clarifies the legacy topic: its narrative proposed beating the market, while its original selection code only ranked sectors. The maintained example makes the benchmark condition explicit and separately adds a positive-trend gate. It is a defined educational rule, not a verified replication of an earlier equity curve.
Five slots also do not require five holdings. With three qualifying sectors, each receives one third of capital. A restrictive gate can therefore reduce the number of exposures while increasing concentration in the survivors.
A ranking becomes a portfolio only after execution
The worked notebook constructs six sector paths and a market path. It separates the signal date from the trade date and the first return earned by the resulting holdings.
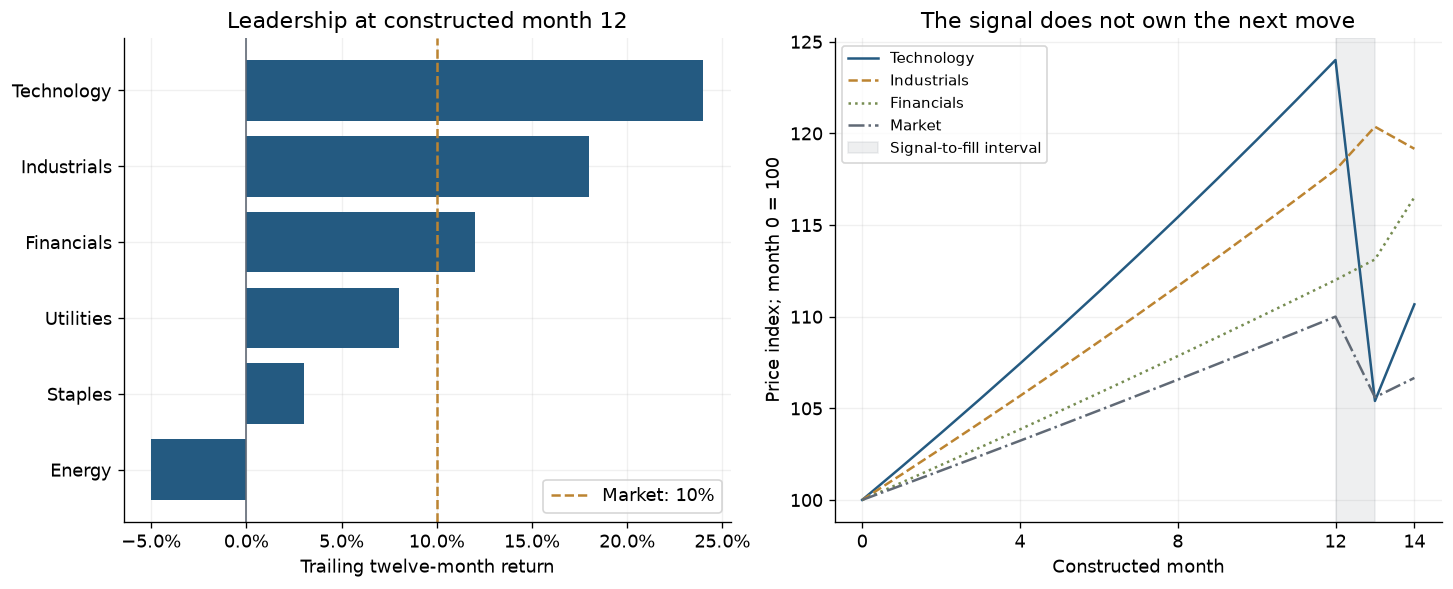
Constructed monthly prices. The ranking uses month 12; the shaded interval separates the signal from execution at month 13. Returns earned by the new position begin after that execution.
| Event | Constructed month | Economic meaning |
|---|---|---|
| Information cutoff | 12 | Calculate momentum and freeze target weights |
| Execution | 13 | Buy the selected basket at the declared prices |
| First return measurement ends | 14 | Measure the return actually earned by those holdings |
Technology, Industrials and Financials subsequently earn 5%, -1% and 3% between execution and the next endpoint. Equal weight produces a gross basket return of
\[\frac{5\%-1\%+3\%}{3}=2.3333\%.\]Starting with wealth of 100, an entry fee of five basis points per traded notional leaves $100/(1+0.0005)$ available for assets. Selling the terminal holdings incurs the same rate on their sale value. Terminal wealth is therefore
\[100\times(1+0.0233333)\times\frac{1-0.0005}{1+0.0005}=102.2311.\]The resulting net gain is about 2.2311% for this single constructed holding period. A large move between signal and execution belongs to whoever owned the assets then; it cannot be credited to the new portfolio. The notebook checks the cash-flow arithmetic independently and verifies that changing later prices cannot change the original selection.
What the example does not settle
The strategy’s economic hypothesis is persistent sector leadership after costs. A historical test needs eligible funds and sector classifications as they existed at each decision date, distribution-adjusted prices, a rebalance calendar and honest execution assumptions. Missing histories cannot be repaired by backfilling a fund before it existed.
A sector portfolio may also inherit concentrated market, growth, value or commodity exposures. A higher return than a broad-market benchmark can reflect those risks, rather than a successful rotation signal. A fair comparison includes an equal-sector portfolio on the same universe and dates, along with holdings, turnover, adverse periods and uncertainty.
The twelve-month horizon, five-position cap and two eligibility filters are research choices. Trying many alternatives and reporting only the strongest version creates selection bias. The backtest-selection chapter illustrates why the full search record matters. Purged validation becomes relevant when a predictive extension uses overlapping forward-return labels; it is not a substitute for chronological execution.
To explore a different timing hypothesis, read sector reversal, which ranks recent losers. To change the amount of exposure independently of the ranking, read volatility targeting. The detailed momentum note, executed notebook, and allocation collection connect the mechanisms without turning them into an after-the-fact performance contest.